Adjustable-rate mortgages are most widely used in expensive metro areas
Housing affordability in the U.S. is worsening as housing prices continue to increase at a record- pace along with rising mortgage rates.[1] Between December 2020 and March 2022 the average mortgage rate on 30-year, fixed-rate mortgages (FRM) jumped up by 149 basis points or 1.49%, whereas rates on 5/1 adjustable-rate mortgages (ARMs) increased by only 40 basis points for the same period.[2] This increase in mortgage rate on FRM is incentivizing buyers to take out ARMs.
After the housing bubble burst in 2007, the use of FRM has been more widespread than ARM. The ARM share of the dollar volume of mortgage originations moved from almost 45% of the total in mid-2005 to a low of 2% in mid-2009. Since then, the ARM share has fluctuated between about 8% and 18% of mortgage originations, depending on the prevailing rate on a FRM (Figure 1). The ARM share declined during the pandemic and reached a 10-year low of 4% of originations in January 2021. As the fixed mortgage interest rates have increased from below 3% to the current March 2022 levels, which were last seen in 2018, borrowers are once again incentivized to consider an ARM. As of March 2022, the ARM share accounted for 13% of the dollar volume of conventional single-family mortgage originations, a threefold increase since January 2021. If the mortgage rates on FRMs continue to increase in the coming years, the share of loans originated with an ARM will likely increase as well.
Figure 1: Comparing the ARM Share with Mortgage Rates: Jan 2010 to March 2022
(Monthly Conventional ARM Home Loans Share)

Source: CoreLogic Public Records and Freddie Mac, 2022
© 2022 CoreLogic,Inc., All rights reserved.
The ARM share varies significantly by location and loan amount. ARMs are more common among homebuyers borrowing large-balance mortgage loans (especially jumbo loans) than for those with smaller loans. Among mortgages of more than $1 million originated during March 2022, ARM comprised 37% of the dollar volume, up seven percentage points from March 2021 (Figure 2). Among mortgages in the $400,001 to $1 million range, the ARM share was about 10%, up five percentage points from March 2021. Among mortgages in the $200,001 to $400,000 range, the ARM share was just 4% for March 2022, up three percentage points from March 2021.
Figure 2: Conventional ARM Share by Loan Size: Jan 2005 to March 2022

© 2022 CoreLogic,Inc., All rights reserved.
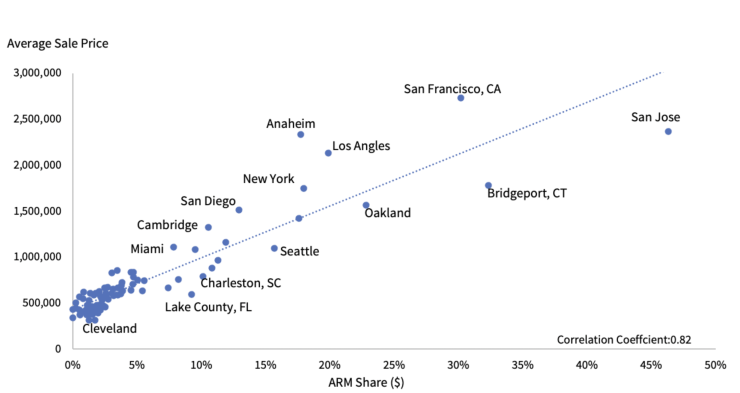
As an ARM has a lower initial interest rate than FRM buyers see bigger monthly savings in the initial payment, especially for larger loans when compared to an FRM. Figure 3 plots the average sale price against the ARM share for metro areas in 2022 (January and February).[3] There is a strong relationship between the average sale price and the ARM share. The ARM share is higher for metros with higher average sales prices. For example, San Jose, California, San Francisco, California and Bridgeport, Connecticut metros were among the areas with the highest average sale price and the largest share of ARM out of all conventional mortgage originations in 2022 (January and February).
Figure 3: The ARM Share Is Higher in Metros with Higher Average Sale Price in 2022

Source: CoreLogic TrueStandings Servicing (Jan and Feb 2022 originations)
© 2022 CoreLogic,Inc., All rights reserved.
Though the ARM share is rising with increasing mortgage rates, it is below the pre-Great Recession level. The ARMs today are different than the pre-Great Recession ARMs. About 60% of ARMs originated during 2007 were low- and no-documentation loans compared with 40% of FRMs. Similarly, 29% of borrowers with ARMs during 2005 had a credit score below 640, compared with only 13% of FRMs for the same period. Today, almost all conventional loans, including both ARMs and FRMs, require full documentation, amortized, and made to borrowers with credit scores above 640. As mortgage interests are rising, an ARM could be a good option if the homeowner or homebuyer’s circumstances fit.
[1] See
[2] The rate on 30-year FRMs surged to 4.17 in March 2022 from 2.68 in December 2020. However, the rate on 5/1 ARMs rose only to 3.19 in March 2022 from 2.79 in December 2020 (Source: Freddie Mac).
[3] Metro areas used in this analysis are Core Based Statistical Areas.


