-
Smaller builders felt the greatest impact of material cost increases, as new Trump administration tariffs add a layer of worry for the construction industry.
 August 25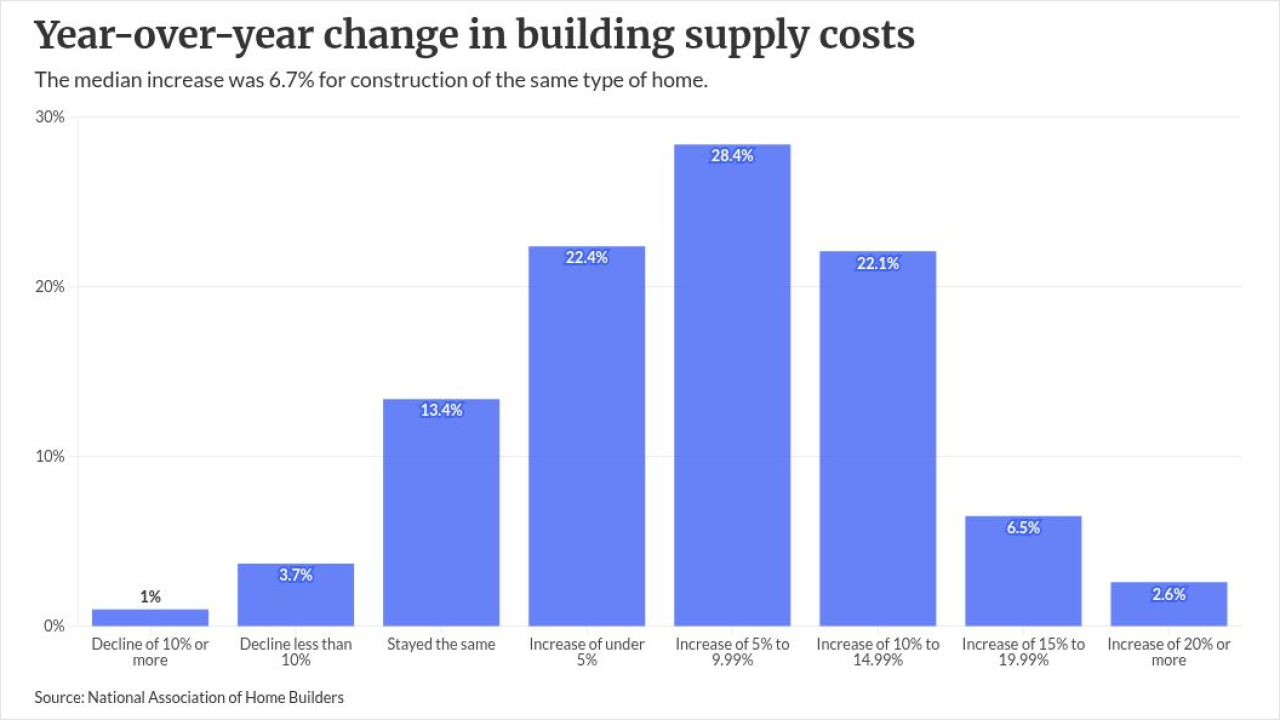
-
Price gains slowed to a crawl from May to June, specifically in the West, but Central and East Coast regions showed steady year-over-year gains.
 August 25
-
The seller surplus was a result of sluggish demand as opposed to increased supply. The 30-year fixed-rate mortgage rose every week in July to 6.66%.
 August 13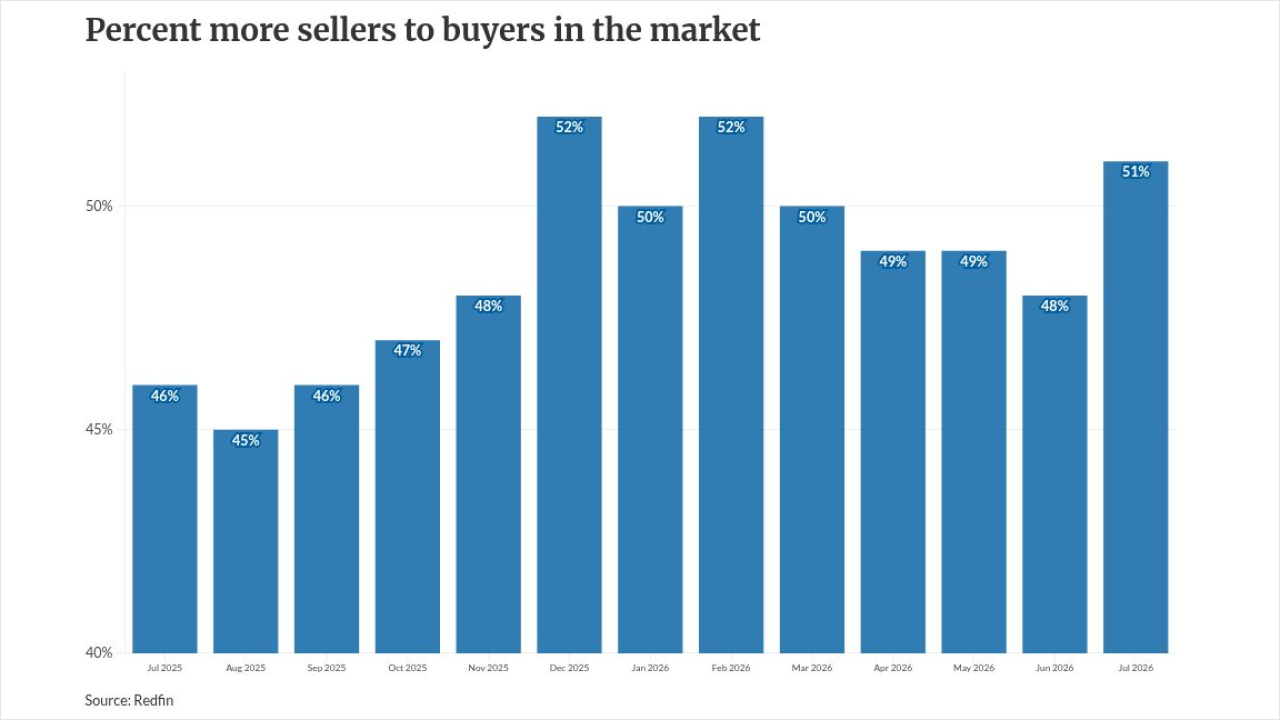
-
Pending home sales, a real-time indicator of homebuying demand, dropped 2.5% to their lowest level since December, according to Redfin's latest report.
August 12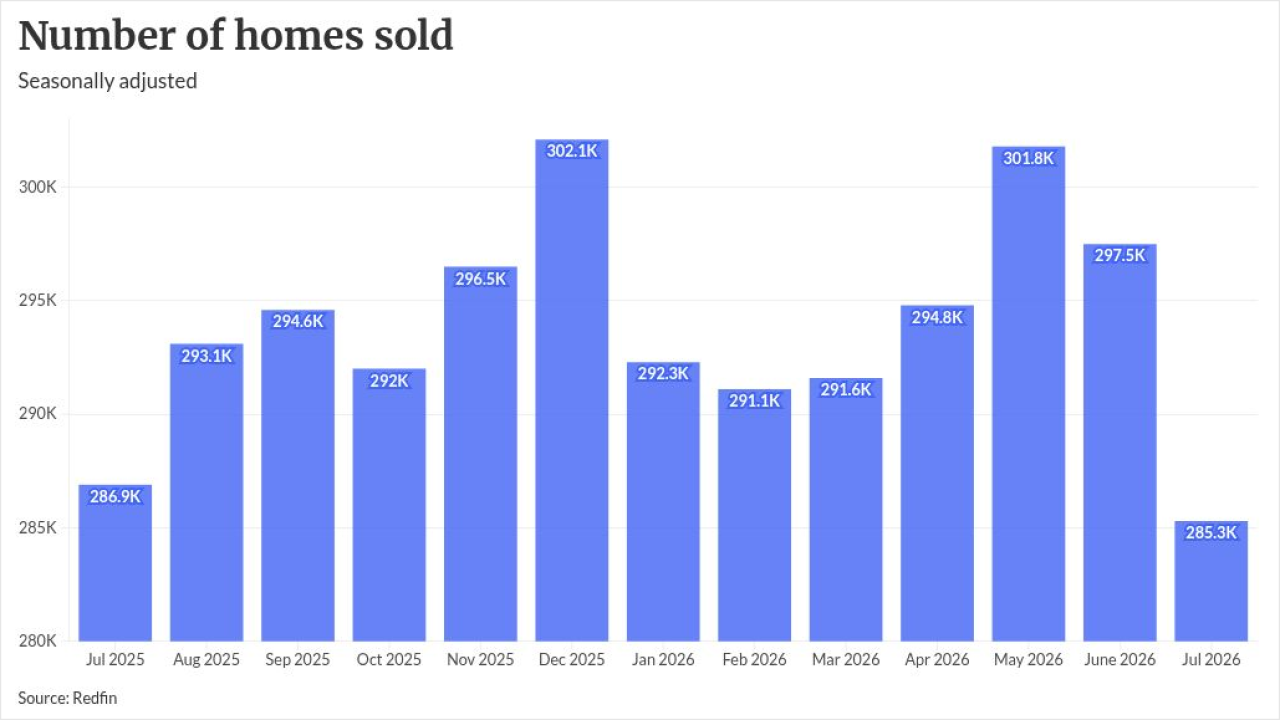
-
The new record arrives after five months of annual home-price growth, which surged to its highest in more than a year, according to ICE Mortgage Technology.
August 10
-
The average down payment across the list was 17.1%, well above 13.1% nationally, and the median credit score was 766, compared with 747 countrywide.
August 10
-
By region, the Northeast — where the supply of homes has been tighter than some other areas — saw the biggest price gain, with the median for an existing single-family home rising 3.8% over the year to $547,200.
August 4
-
While U.S. home values fell in real terms for the 12th consecutive month, voices say slow inventory growth has flipped the script away from the south and towards east metros.
 July 28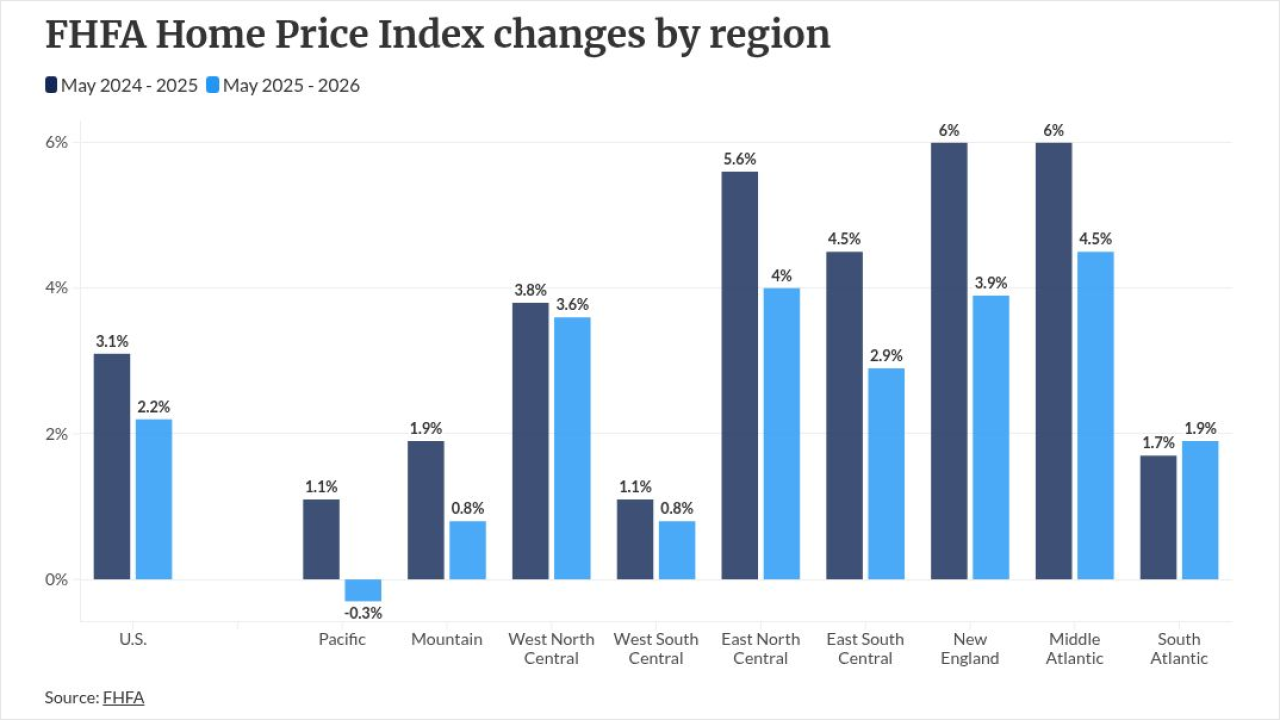
-
Home price growth is accelerating as inventory stalls—Chicago and Pittsburgh lead mid-tier gains at 4.2%, while Denver and Las Vegas see supply-driven price corrections.
July 27
-
ICE data reveals home value growth hit a 15-month high, prompting originators to target resilient markets like upstate New York and pivot focus toward single-family inventory.
July 23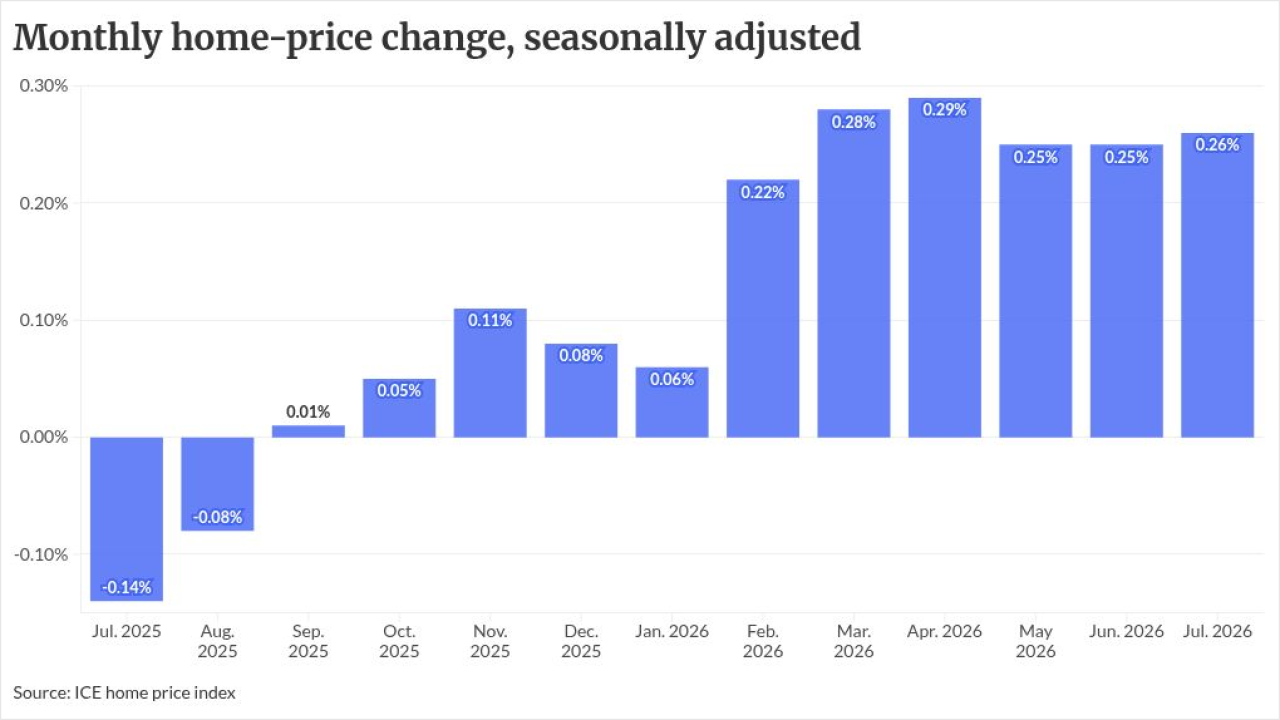
-
Home values have increased 147% over the last 15 years, pushing more homeowners above the capital gains tax exemption thresholds, according to Cotality.
July 20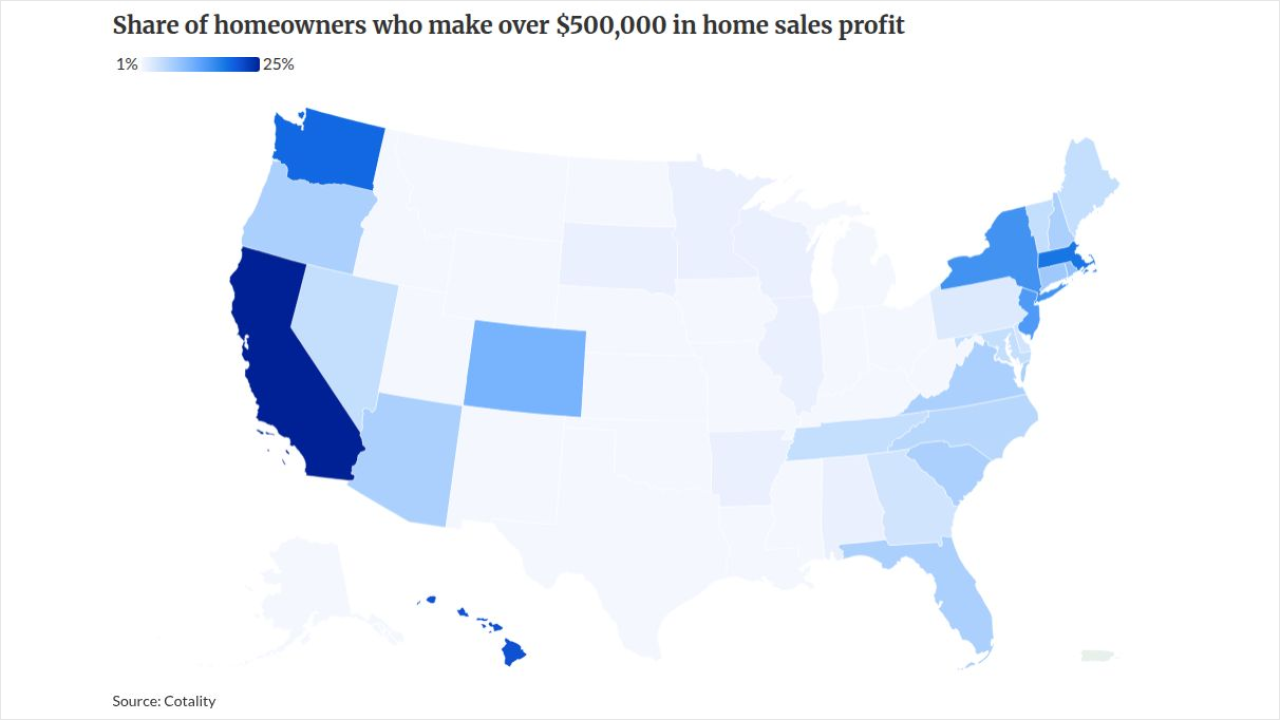
-
Realtor.com's latest forecast projects prices will grow 1.2% in 2026, lower than its original estimate of 2.2% and well below the current pace of inflation.
July 9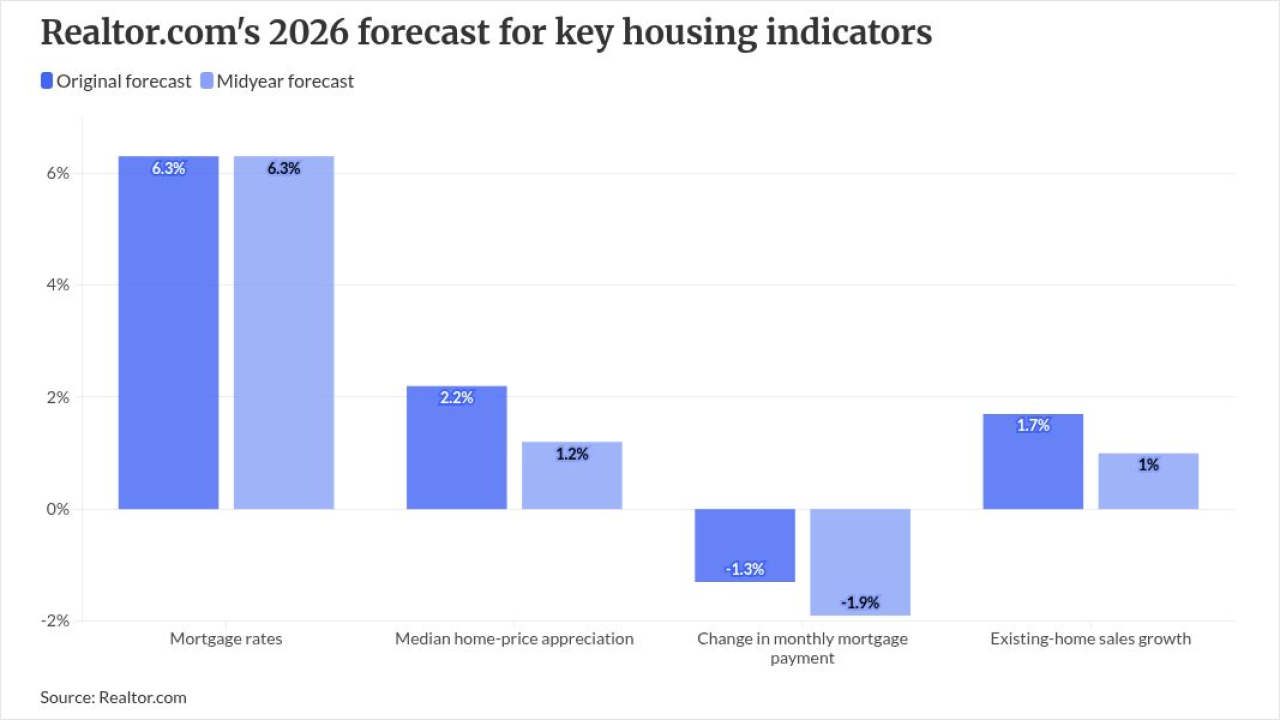
-
Contract closings fell 2.4% to an annualized rate of 4.09 million last month, data released Thursday by the National Association of Realtors show.
July 9
-
The S&P Cotality Case-Shiller home price index rose 0.8% year over year in April, while U.S. Federal Housing's index climbed 2%. Both indexes declined monthly.
June 30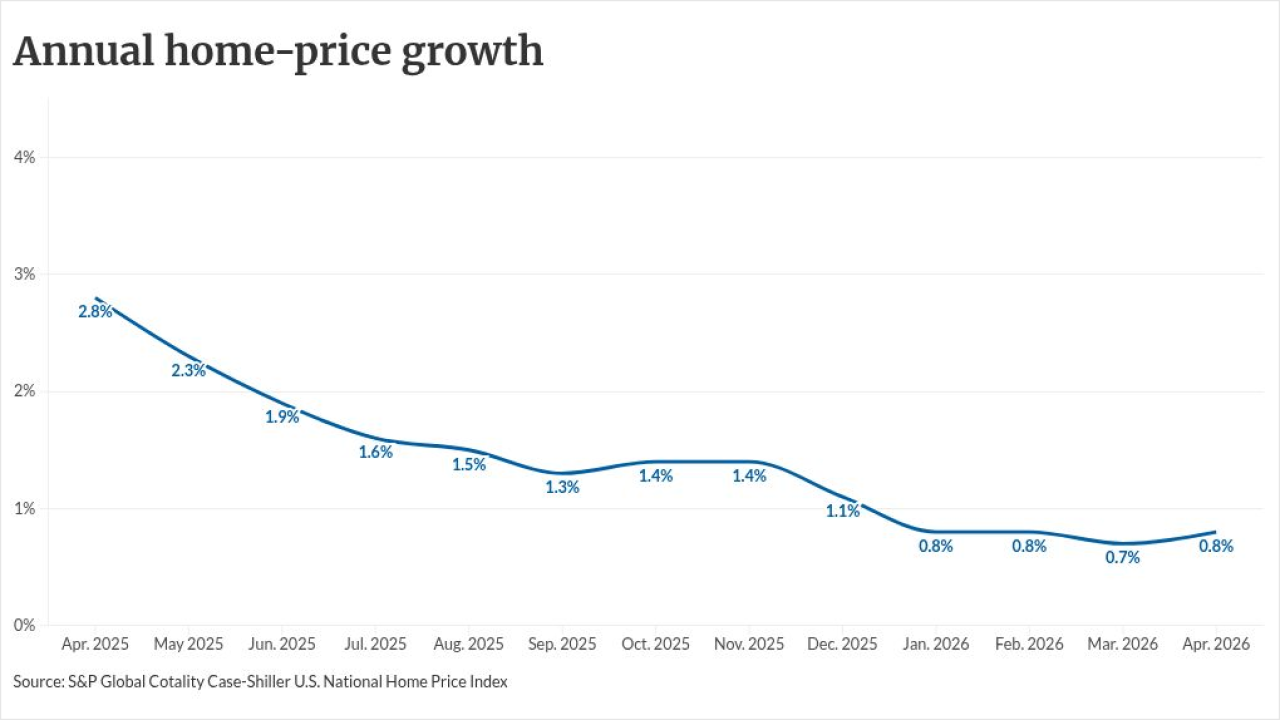
-
But moderating price growth and friendly building policies in many markets hint at emerging affordability for aspiring buyers, Zillow said.
June 15
-
All-cash home purchases hit a six-year March low of 28.9%, as a buyer-friendly market reduced the need to use cash to stand out, with sellers outnumbering buyers by a record-near margin, Redfin found.
May 27
-
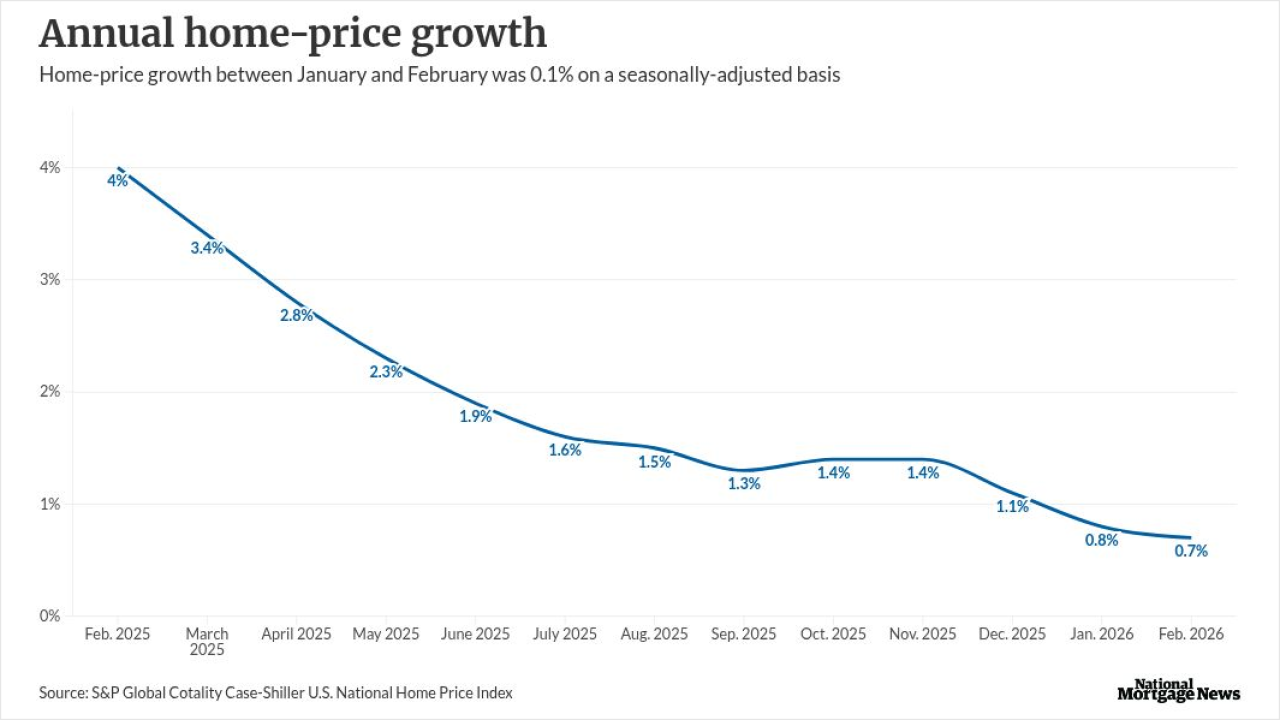
Home prices rose 0.7% annually in March, down from a 0.8% increase in the previous month, according to the S&P Cotality Case-Shiller home price index.
May 26
-
The share of sellers dropping their asking price fell in April as buyer demand picked up, though Sun Belt markets — especially in Texas — still saw widespread price cuts.
May 20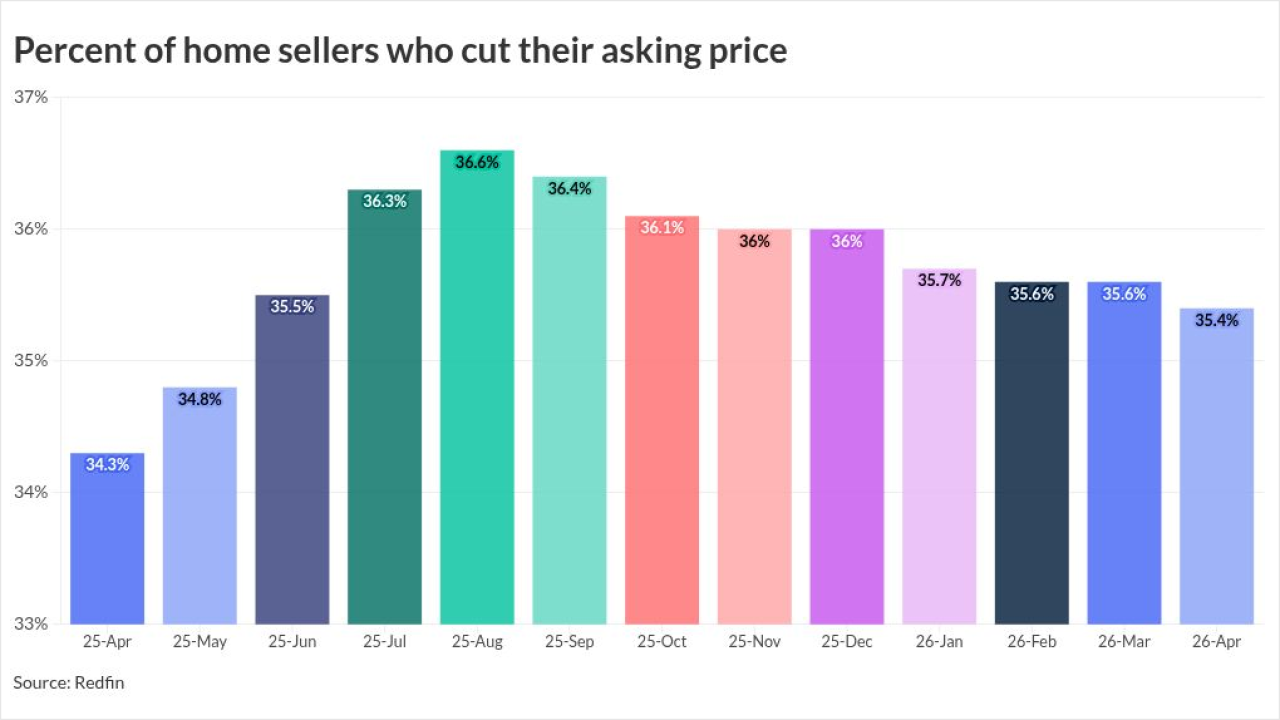
-
Prices rose 0.32% last month on a seasonally adjusted basis, equal to a 3.9% annualized rate, according to ICE Mortgage Technology's mortgage monitor report.
May 11
-
More than half of the major metropolitan markets in the United States posted year-over-year price declines in February, according to a new report.
April 28