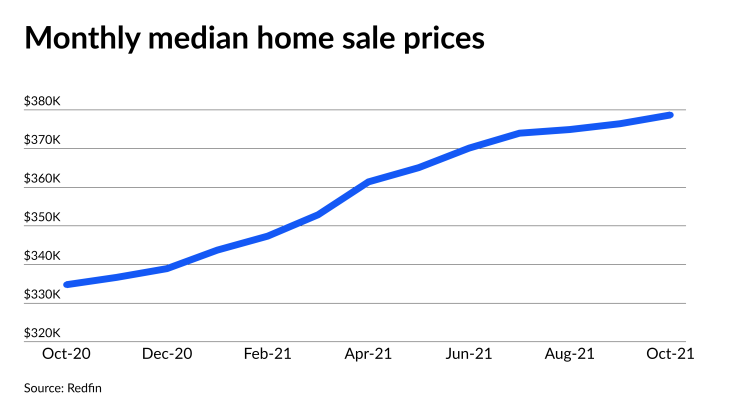
While the housing market experienced its normal seasonal activity pattern in October, consumer demand in early November reached its highest point since at least 2017, Redfin said.
Seasonally adjusted home sales fell by 8.1%

But Redfin's Homebuyer Demand Index rose 6.7 points during the week ended Nov. 14, to 170, the highest level since the real estate company began compiling this data in 2017. That is a 23% increase over the same week one year ago, when the index was at 128.
"Homebuyers who were waiting until fall or winter to try to find a home in a less competitive market may be disappointed," Redfin Chief Economist Daryl Fairweather said. “Even record-high home prices have not convinced many homeowners to sell."
It might take until the second half of 2022 for the inventory shortage to abate as
Seasonally adjusted new listings were down 0.9% from September and 10.6% from October 2022 to 635,800 units.
That 8.1% annual decline in home sales to a seasonally adjusted 608,400 units was the largest drop in 16 months, Redfin said.
Of the 85 large metro areas tracked by Redfin, Bridgeport, Connecticut, was the only market with an annual price decline, down 4.2%. It also had the largest percentage decline in home sales, down 26%. That was followed by New Brunswick, New Jersey, where sales were 22% lower and Salt Lake City, which was down by 21%.
The largest percentage increases in sales were in areas that had still been somewhat depressed in October 2020: Honolulu, up 18%; New York, up 11%, and San Jose, California, up 7%.
Approximately 46% of properties sold above their list price in October, down 2.1 percentage points from September and 11 percentage points from June's all-time high. But it was still 11 percentage points higher from the same month in 2020.
In October, the median days a listing remained on the market was 21 days, up 3 days from September, but down by 8 days compared with October 2020.


