p1b5lmdl8cgui1q6gnur143b19nn6.jpg
Donald Trump's election in November triggered a rise in interest rates that is expected to continue this year. With talk of deregulation and privatizing Fannie Mae and Freddie Mac, the mortgage industry is waiting to see what other effects Trump will have on the housing sector after he takes office. A new president's impact on the industry often depends on the economic situation he inherits, such as high inflation at the beginning of the Reagan administration and soaring foreclosures at the start of Obama's first term. Here's a rundown of how housing performed in the first years in office of the past six commanders in chief, based on data from Freddie Mac, the Mortgage Bankers Association and the National Association of Realtors.
p1b5lmdn7l1lip5541vhe1kklbvn7.jpg

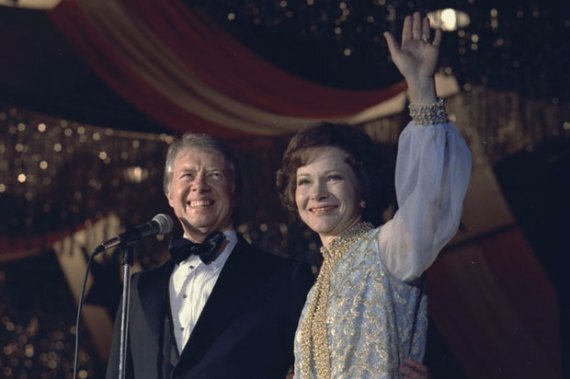
Jimmy Carter

Annual Average Interest Rate for Conventional Conforming 30-Year Fixed-Rate Mortgage 1976: 8.87% 1977: 8.85% Change: 2 basis points lower Total Mortgage Origination Volume 1976: $112.78 billion 1977: $161.98 billion Change: +43.6% Median Price of Existing Single-Family Home 1976: $38,075 1977: $42,750 Change: +12.3% 90+ Day Delinquency Rate 1976: 0.55% 1977: 0.51% Change: 4 basis points lower Foreclosure Rate 1976: 0.69% 1977: 0.70% Change: 1 basis point higher
p1b5lmdp0tohm1c66a35h3duql8.jpg

Ronald Reagan

Annual Average Interest Rate for Conventional Conforming 30-Year Fixed-Rate Mortgage 1980: 13.74% 1981: 16.63% Change: 289 basis points higher Total Mortgage Origination Volume 1980: $133.76 billion 1981: $98.21 billion Change: -26.6% Median Price of Existing Single-Family Home 1980: $62,050 1981: $66,125 Change: +6.7% 90+ Day Delinquency Rate 1980: 0.62% 1981: 0.64% Change: 2 basis points higher Foreclosure Rate 1980: 0.58% 1981: 0.66% Change: 8 basis points higher
p1b5lmdqr61n0o1co3gtbct72fi9.jpg

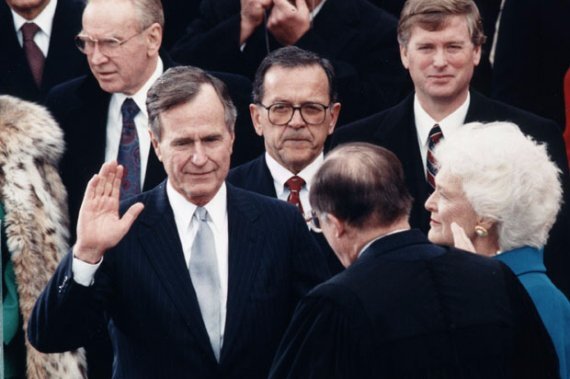
George H.W. Bush

Annual Average Interest Rate for Conventional Conforming 30-Year Fixed-Rate Mortgage 1988: 10.34% 1989: 10.32% Change: 2 basis points lower Total Mortgage Origination Volume 1988: $446.26 billion 1989: $452.91 billion Change: +1.5% Median Price of Existing-Single Family Home 1988: $89,200 1989: $94,308 Change: +5.7% 90+ Day Delinquency Rate 1988: 0.83% 1989: 0.75% Change: 8 basis points lower Foreclosure Rate 1988: 1.07% 1989: 1.30% Change: 23 basis points higher
p1b5lmdscfakh1fvs9h13ik1jqma.jpg

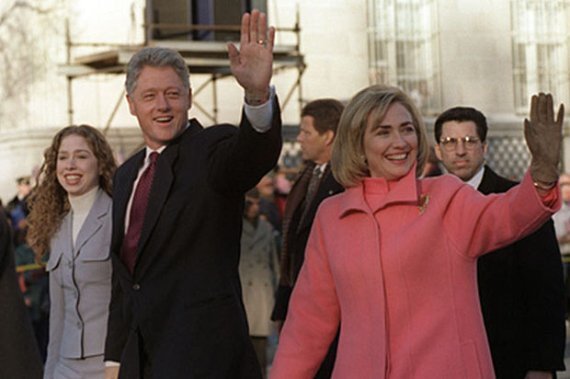
Bill Clinton

Annual Average Interest Rate for Conventional Conforming 30-Year Fixed-Rate Mortgage 1992: 8.39% 1993: 7.31% Change: 108 basis points lower Total Mortgage Origination Volume 1992: $893.68 billion 1993: $1.02 trillion Change: +14.1% Median Price of Existing Single-Family Home 1992: $105,050 1993: $108,250 Change: +3.0% 90+ Day Delinquency Rate 1992: 0.76% 1993: 0.75% Change: 1 basis point lower Foreclosure Rate 1992: 1.32% 1993: 1.26% Change: 6 basis points lower
p1b5lmdtvt10feev412l0u0n1kleb.jpg

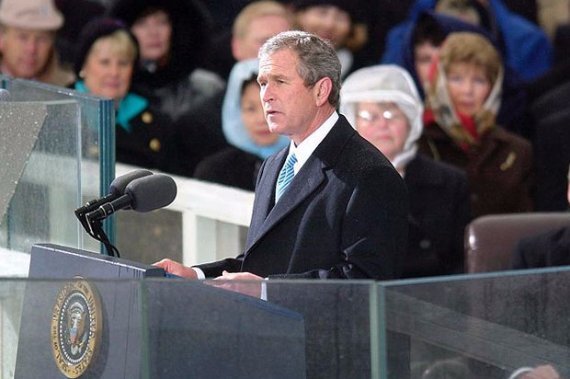
George W. Bush

Annual Average Interest Rate for Conventional Conforming 30-Year Fixed-Rate Mortgage 2000: 8.05% 2001: 6.97% Change: 108 basis points lower Total Mortgage Origination Volume 2000: $1.13 trillion 2001: $2.24 trillion Change: +96.9% Median Price of Existing Single-Family Home 2000: $146,008 2001: $154,508 Change: +5.8% 90+ Day Delinquency Rate 2000: 0.66% 2001: 0.83% Change: 17 basis points higher Foreclosure Rate 2000: 1.52% 2001: 1.79% Change: 27 basis points higher
p1b5lmdvgd7op8ia1ppnmjkgjtc.jpg

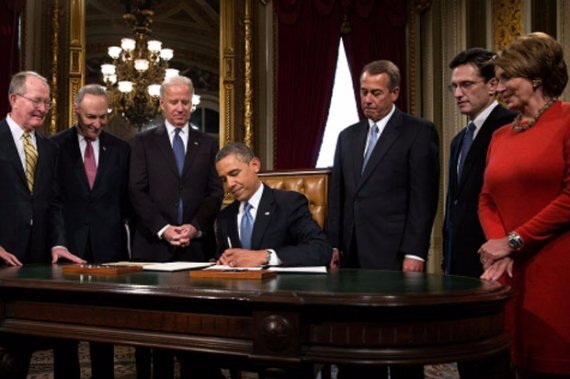
Barack Obama

Annual Average Interest Rate for Conventional Conforming 30-Year Fixed-Rate Mortgage 2008: 6.03% 2009: 5.04% Change: 99 basis points lower Total Mortgage Origination Volume 2008: $1.51 trillion 2009: $2.00 trillion Change: +32.2% Median Price of Existing Single-Family Home 2008: $195,775 2009: $172,492 Change: -11.9% 90+ Day Delinquency Rate 2008: 2.75% 2009: 4.62% Change: 187 basis points higher Foreclosure Rate 2008: 4.26% 2009: 5.37% Change: 111 basis points higher
MORE FROM NATIONAL MORTGAGE NEWS