A handful of markets that bottomed out later in the cycle are still down 20% or more from their peak. But other markets are much closer to fully recovering from the housing crash.
"Home prices are still below prerecession peaks in 46% of local markets, but nearly one-third of even those markets posted double-digit home price appreciation in the first quarter," Daren Blomquist, senior vice president at Attom Data Solutions, said in a press release.
Overall, the national median home price increased 9.1% to $240,000 year-over-year in 1Q18, which is only 1% below the $240,500 prerecession peak from the third quarter of 2005.
Historically lower home prices for some markets isn't necessarily a bad thing, as the dynamic between tight supply and high demand for housing has pushed home values close to 70% above prerecession peaks in certain cities.
The markets nearing their previous peaks present a good opportunity for lenders, as home buyers may face fewer affordability challenges in these cities, especially with rising mortgage rates creating additional cost hurdles for consumers.
Here's a look at the 12 housing markets that are still below their peak price, but are closest to crossing that threshold. The data, from Attom, is based on first quarter 2018 home sales in metropolitan statistical areas with at least 1,000 single-family home and condo sales per quarter.

No. 12: Akron, Ohio
Post-recession bottom: $62,950 (1Q09)
1Q18 home price: $115,000
Change from peak: -7.3%
Change from bottom: 82.7%

No. 11: Tampa, Fla.
Post-recession bottom: $85,900 (1Q11)
1Q18 home price: $185,000
Change from peak: -7.3%
Change from bottom: 115.4%

No. 10: Albany, N.Y.
Post-recession bottom: $170,000 (1Q09)
1Q18 home price: $180,500
Change from peak: -6%
Change from bottom: 6.2%

No. 9: Phoenix, Ariz.
Post-recession bottom: $109,000 (1Q11)
1Q18 home price: $245,000
Change from peak: -5%
Change from bottom: 124.8%

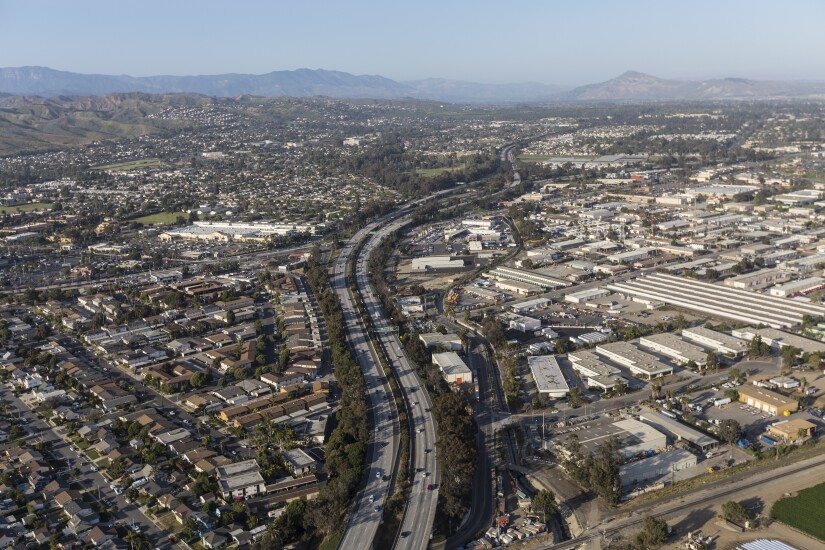
No. 8: Oxnard, Calif.
Post-recession bottom: $329,000 (1Q09)
1Q18 home price: $575,000
Change from peak: -4.2%
Change from bottom: 74.8%

No. 7: Lakeland, Fla.
Post-recession bottom: $80,000 (1Q11)
1Q18 home price: $169,900
Change from peak: -4%
Change from bottom: 112.4%

No. 6: Richmond, Va.
Post-recession bottom: $150,000 (1Q12)
1Q18 home price: $210,000
Change from peak: -2.8%
Change from bottom: 40%

No. 5: Jacksonville, Fla.
Post-recession bottom: $102,092 (1Q12)
1Q18 home price: $185,000
Change from peak: -2.6%
Change from bottom: 81.2%

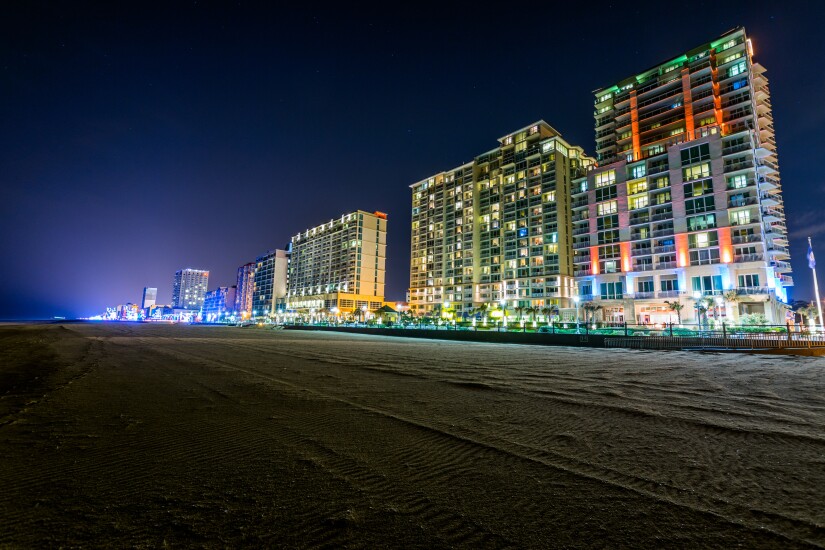
No. 4: Virginia Beach, Va.
Post-recession bottom: $179,000 (1Q12)
1Q18 home price: $220,000
Change from peak: -2.2%
Change from bottom: 22.9%

No. 3: Harrisburg, Pa.
Post-recession bottom: $135,000 (1Q12)
1Q18 home price: $149,900
Change from peak: -2%
Change from bottom: 11%

No. 2: Dayton, Ohio
Post-recession bottom: $70,000 (1Q09)
1Q18 home price: $108,000
Change from peak: -1.8%
Change from bottom: 54.3%

No. 1: Greensboro, N.C.
Post-recession bottom: $101,500 (1Q12)
1Q18 home price: $128,000
Change from peak: -1.5%
Change from bottom: 26.1%


