
The shift comes as distressed housing inventory has dried up, forcing investors to pay closer to market value and rely on price appreciation to generate a profit.
Nationally, only about one-third of flippers use financing for the initial home purchase. But on the local level, markets like Washington, D.C., and Colorado Springs, Colo., saw flippers use financing on more than 60% of transactions.
Here's a look at the 12 states with the highest share of investors using financing for flipping houses.

No. 12: Oregon
Number of home flips: 851
Median initial purchase price: $200,000
Average days to flip: 190

No. 11: Virginia
Number of home flips: 1,134
Median initial purchase price: $156,500
Average days to flip: 181

No. 10: Nebraska
Number of home flips: 262
Median initial purchase price: $106,000
Average days to flip: 195

No. 9: Washington
Number of home flips: 1,672
Median initial purchase price: $203,500
Average days to flip: 188

No. 8: Arkansas
Number of home flips: 254
Median initial purchase price: $106,450
Average days to flip: 183

No. 7: Arizona
Number of home flips: 2,746
Median initial purchase price: $160,000
Average days to flip: 166
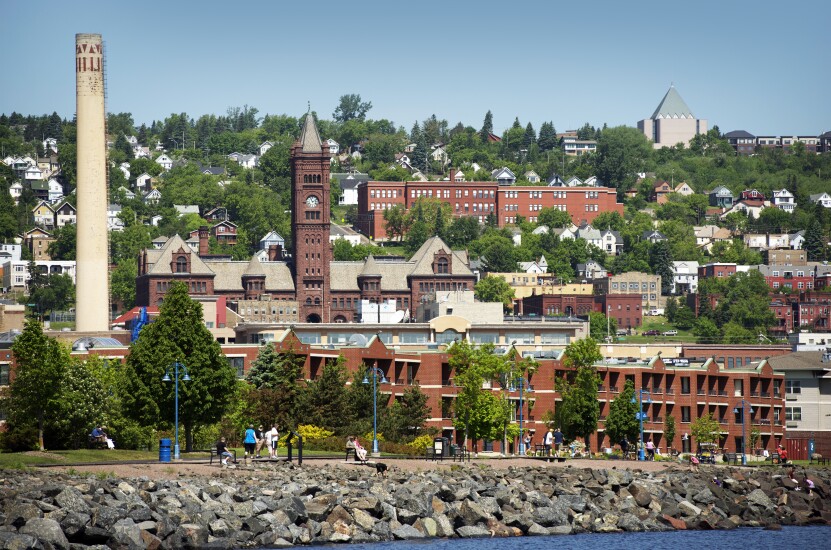
No. 6: Minnesota
Number of home flips: 561
Median initial purchase price: $150,000
Average days to flip: 197
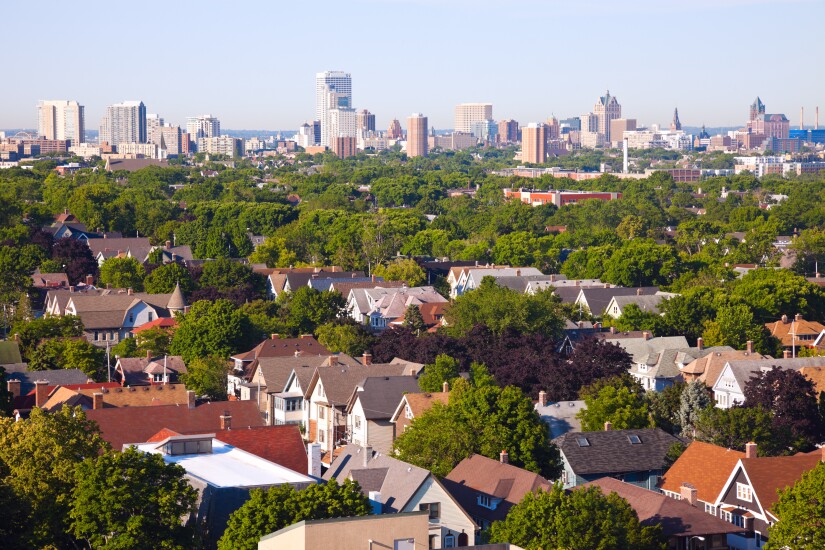
No. 5: Wisconsin
Number of home flips: 481
Median initial purchase price: $105,000
Average days to flip: 193

No. 4: Massachusetts
Number of home flips: 880
Median initial purchase price: $220,000
Average days to flip: 211

No. 3: Rhode Island
Number of home flips: 180
Median initial purchase price: $138,750
Average days to flip: 200

No. 2: New Hampshire
Number of home flips: 150
Median initial purchase price: $188,267
Average days to flip: 203

No. 1: Colorado
Number of home flips: 1,666
Median initial purchase price: $230,000
Average days to flip: 188


