Though favorable conditions could dissipate with a swing in demand, right now,
"While 2018 was largely characterized by declining affordability, ending the year with a 5% yearly decline in house-buying power, this trend reversed sharply in early 2019," Mark Fleming, chief economist for First American Financial Corp., said in a press release. "Moderating home prices, in conjunction with gains in household income and declining mortgage rates, boosted affordability for potential homebuyers."
While in cities like Providence, R.I., "real" house prices shot up 17% year-over-year in January, other areas saw such growth below 1%, according to a First American Financial Corp. analysis of home values, factoring in local wages and mortgage rates in large cities.
From the middle of the country to the Pacific Northwest, here's a look at cities where consumers wield the most purchasing power for the upcoming home buying season.
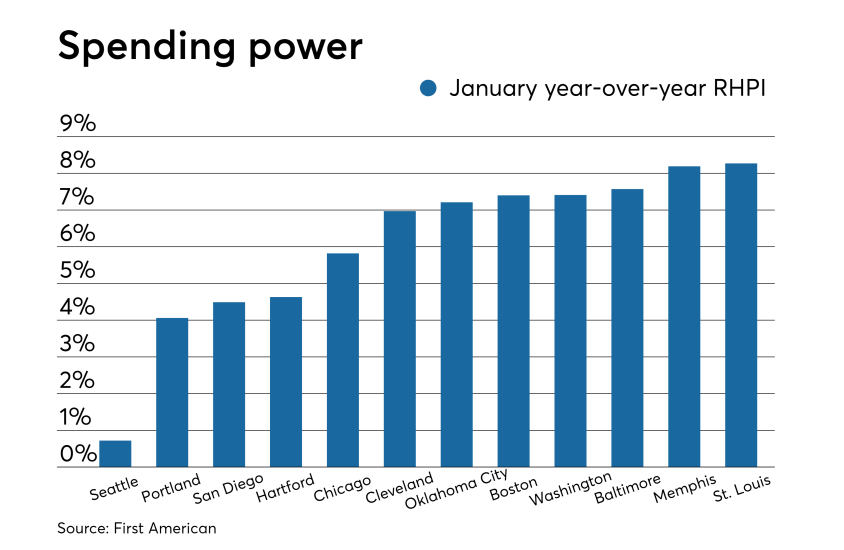
The data, from the First American Real House Price Index, measures annual home price changes, taking local wages and mortgage rates into account "to better reflect consumers' purchasing power and capture the true cost of housing."
The January 2019 data is ranked by smallest year-over-year changes in RHPI for cities where the current value is less than 100 (an RHPI reading of 100 is equal to housing conditions in January 2000).

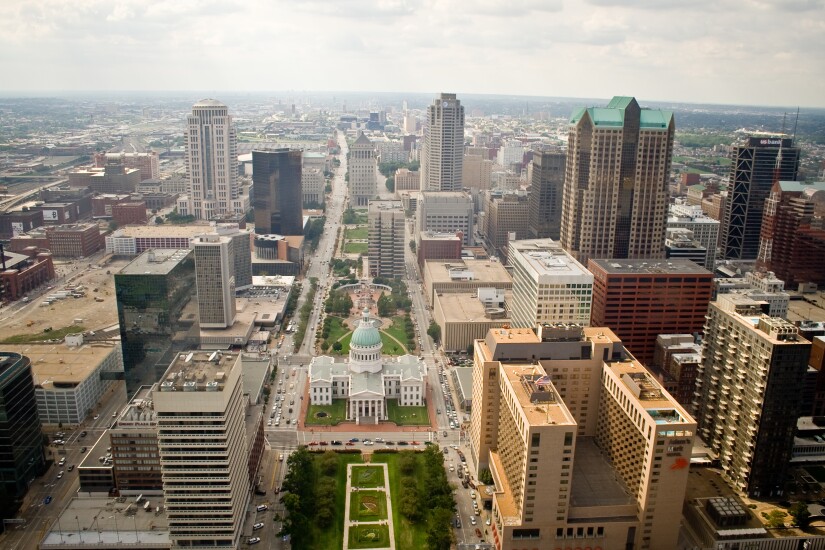
No. 12 St. Louis, Mo.
RHPI: 67.79
Median sale price: $156,947

No. 11 Memphis, Tenn.
RHPI: 55.96
Median sale price: $129,580

No. 10 Baltimore, Md.
RHPI: 81.11
Median sale price: $228,750

No. 9 Washington, D.C.
RHPI: 89.21
Median sale price: $366,726

No. 8 Boston, Mass.
RHPI: 86.59
Median sale price: $437,724

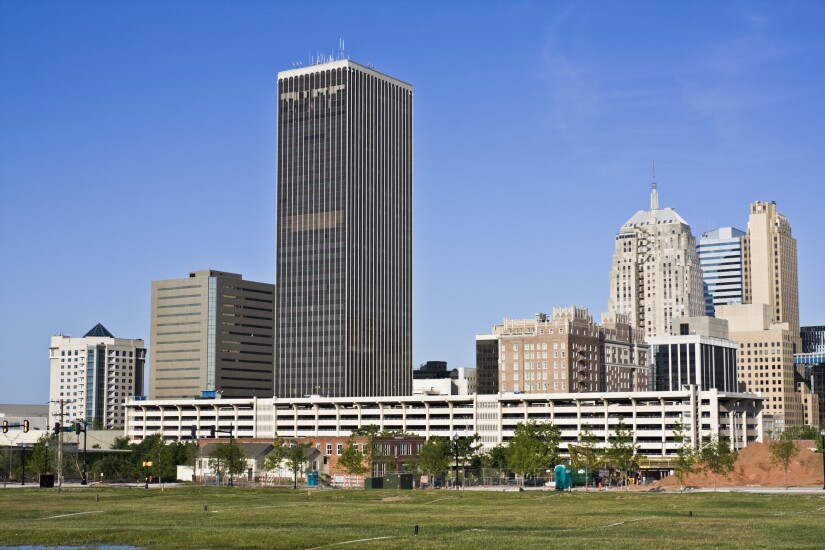
No. 7 Oklahoma City, Okla.
RHPI: 69.05
Median sale price: $146,625

No. 6 Cleveland, Ohio
RHPI: 50.61
Median sale price: $133,563

No. 5 Chicago, Ill.
RHPI: 66.23
Median sale price: $208,952

No. 4 Hartford, Conn.
RHPI: 75.13
Median sale price: $207,456

No. 3 San Diego, Calif.
RHPI: 95.57
Median sale price: $535,375

No. 2 Portland, Ore.
RHPI: 96.9
Median sale price: $358,750

No. 1 Seattle, Wash.
RHPI: 90.04
Median sale price: $445,530


