Of course, just like any other facet of commerce, change hit different metro areas at contrasting speeds.
"The housing market is ending the decade in a vastly different place than it began," Daryl Fairweather, Redfin chief economist, said in the report. "In 2010, the market was in the middle of its
From the heart of Texas to the coast of Florida, here's a look at the 15 housing markets that experienced the largest home price growth of the last 10 years, according to Redfin.
For the analysis, Redfin looked at the 50 most populated metro areas and compared the median home price at the beginning of the decade with the end. Additionally, it also analyzed annual median income growth, the change in homes for sale and seasonally adjusted median days on market.

No. 15 Fort Worth, Texas
Annual median income growth 2010 to 2019: 1.9%
Seasonally adjusted median home price Oct. 2019: $253,890

No. 14 Dallas, Texas
Annual median income growth 2010 to 2019: 1.9%
Seasonally adjusted median home price Oct. 2019: $301,925

No. 13 Los Angeles, Calif.
Annual median income growth 2010 to 2019: 1.3%
Seasonally adjusted median home price Oct. 2019: $644,176

No. 12 Sacramento, Calif.
Annual median income growth 2010 to 2019: 1%
Seasonally adjusted median home price Oct. 2019: $413,333

No. 11 San Francisco, Calif.
Annual median income growth 2010 to 2019: 3.2%
Seasonally adjusted median home price Oct. 2019: $1,409,749

No. 10 Atlanta, Ga.
Annual median income growth 2010 to 2019: 1%
Seasonally adjusted median home price Oct. 2019: $251,011

No. 9 Miami, Fla.
Annual median income growth 2010 to 2019: 0.9%
Seasonally adjusted median home price Oct. 2019: $313,811

No. 8 Denver, Colo.
Annual median income growth 2010 to 2019: 2.8%
Seasonally adjusted median home price Oct. 2019: $424,051

No. 7 San Jose, Calif.
Annual median income growth 2010 to 2019: 3.2%
Seasonally adjusted median home price Oct. 2019: $1,079,022

No. 6 Phoenix, Ariz.
Annual median income growth 2010 to 2019: 0.8%
Seasonally adjusted median home price Oct. 2019: $286,319

No. 5 Oakland, Calif.
Annual median income growth 2010 to 2019: 3.2%
Seasonally adjusted median home price Oct. 2019: $743,678

No. 4 Orlando, Fla.
Annual median income growth 2010 to 2019: 0.5%
Seasonally adjusted median home price Oct. 2019: $259,723

No. 3 Las Vegas, Nev.
Annual median income growth 2010 to 2019: -0.3%
Seasonally adjusted median home price Oct. 2019: $288,711

No. 2 Warren, Mich.
Annual median income growth 2010 to 2019: 1.1%
Seasonally adjusted median home price Oct. 2019: $218,172

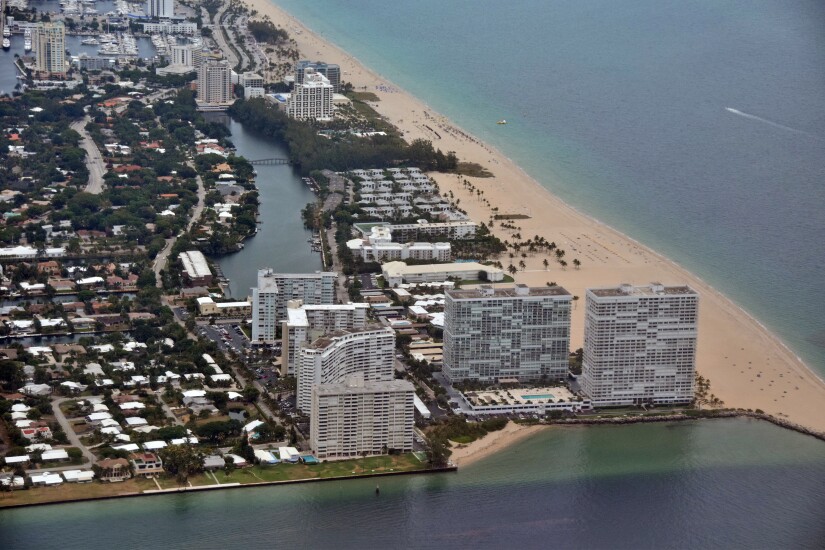
No. 1 Fort Lauderdale, Fla.
Annual median income growth 2010 to 2019: 0.9%
Seasonally adjusted median home price Oct. 2019: $278,058


